 Real estate investors who flip remotely – that is, in another city or state – often have challenges in developing a deep knowledge of the market. This is where a strong technical toolkit can work to their advantage and level the playing field. In this post, we’ll walk through how to use the Redfin.com website to find and narrow down properties located around a wholesale “opportunity.” If you already know how to find comps, but just need to analyze them for ARV, skip ahead to this post.
Redfin is not available in all markets. However, where there is coverage, it is invaluable in two ways. First, it refreshes data every 15 to 30 minutes that is updated by the listing agent. Second, it has an export feature. This allows you to download a spreadsheet of all the data on the comps you found.
If you’ve been using Zillow.com for your comps, you may find quite a few differences with the Redfin interface. Redfin tends to be less intuitive and a little harder to work with, so playing around with the interface is very helpful. This tutorial will take you through all the major features to get you up and running.
The Deal
A property in Los Angeles was sent to us by a wholesaler who claimed the property ARV (after repair value) was $458,000.
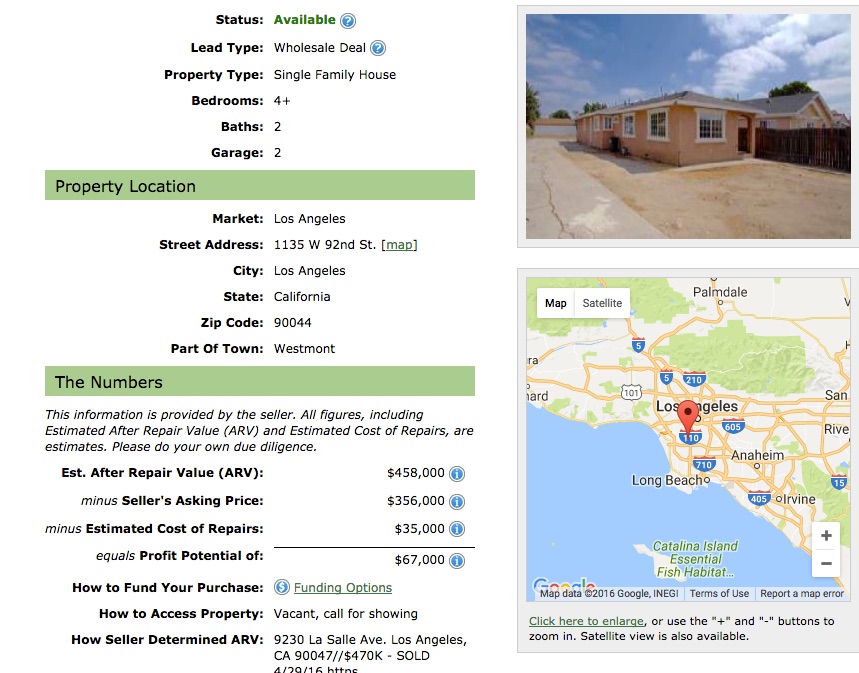
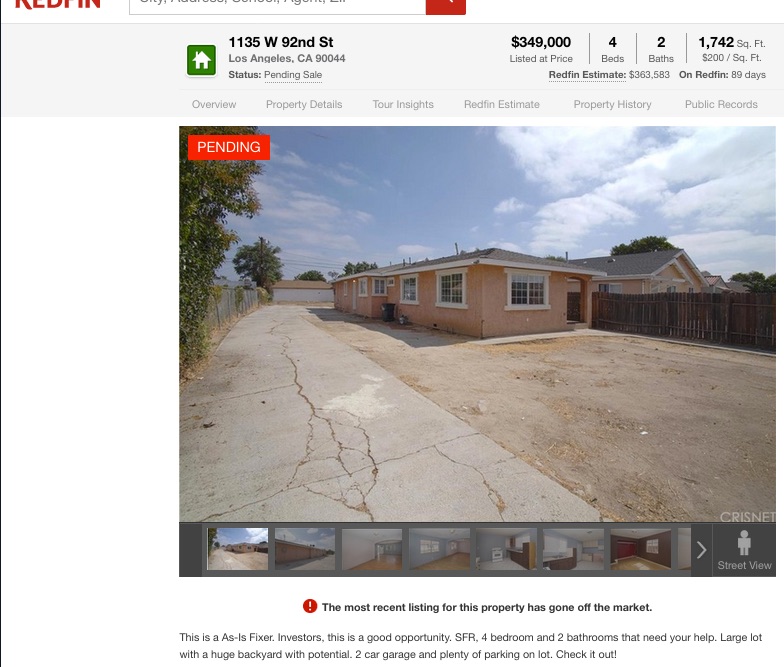
Navigating to Redfin.com, we enter in the property address to view the listing information.
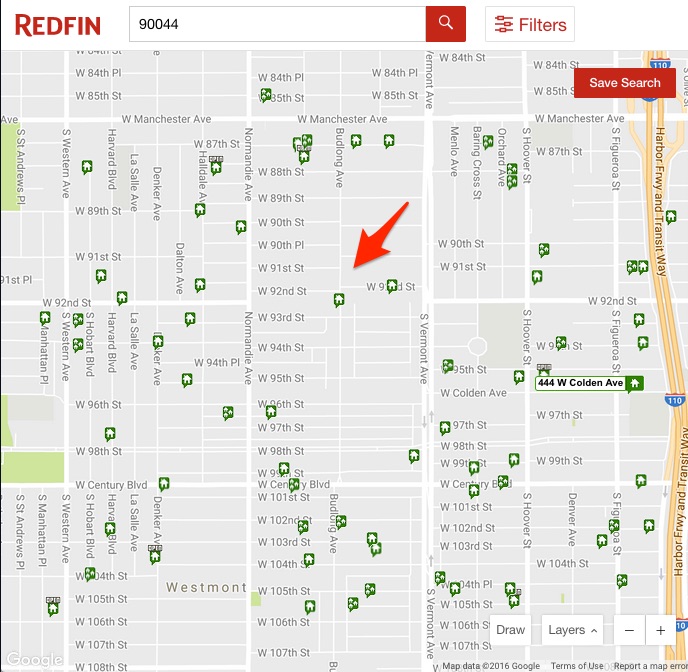
Now, moving on to finding the comps. We perform a new search in the Redfin search bar, this time just the area code: ‘90044’.
Drawing an Area
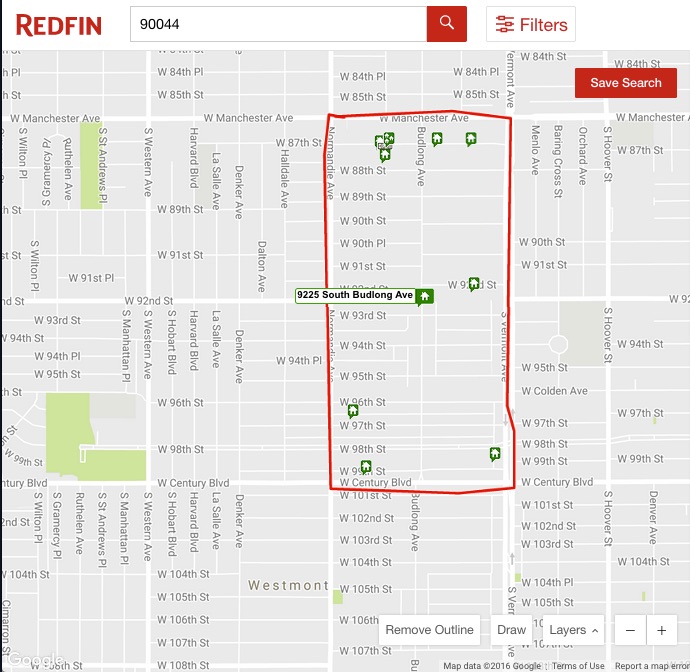
We zoom into the zip code area using the plus sign button on the lower right of the site. Make sure to note the location of the property (arrow in the screenshot below).
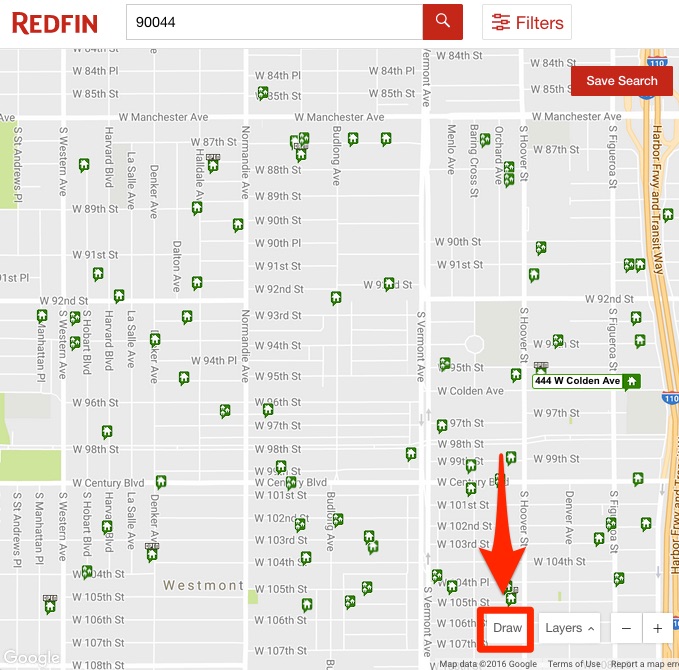
Next we use the ‘Draw’ button to draw an area outline. We do this both to make the data easier to view and also to isolate the sold comps. But first, are there any guidelines as to where to draw?
The answer to that is complex, but typically, neighborhood boundaries follow some type of physical feature. This could be railroads, parks, waterways, highways, major thoroughfares and other boundaries.
To draw the area, click on the ‘Draw’ button. The screen will show a black border that says “Click and drag to draw your search.”
We do just that, drawing around the major four thoroughfares that connect:
Filtering for Sold Properties
Redfin initially shows only active listings, noted by the green house icons. In this next step we will apply a filter that will show us all properties that sold within the last three months.
We click on the ‘Filters’ button in the bar at the top of the screen. The filter popup will appear and we see a number of options already selected. Since this is a single family residence, we want only the ‘House’ option for our comps, so we de-select ‘Condo’, ‘Townhouse’, ‘Multi-family,’ ‘Land,’ and ‘Other Types.’ Also, we only want to see past sales data for this area, so we also de-select ‘For sale’ and “For sale by owner.’ Finally, we select ‘Sale records’ for the ‘Last 3 months.’ Keep in mind to always start out with the most narrow criteria. If there are no or few results, then broaden the search criteria.
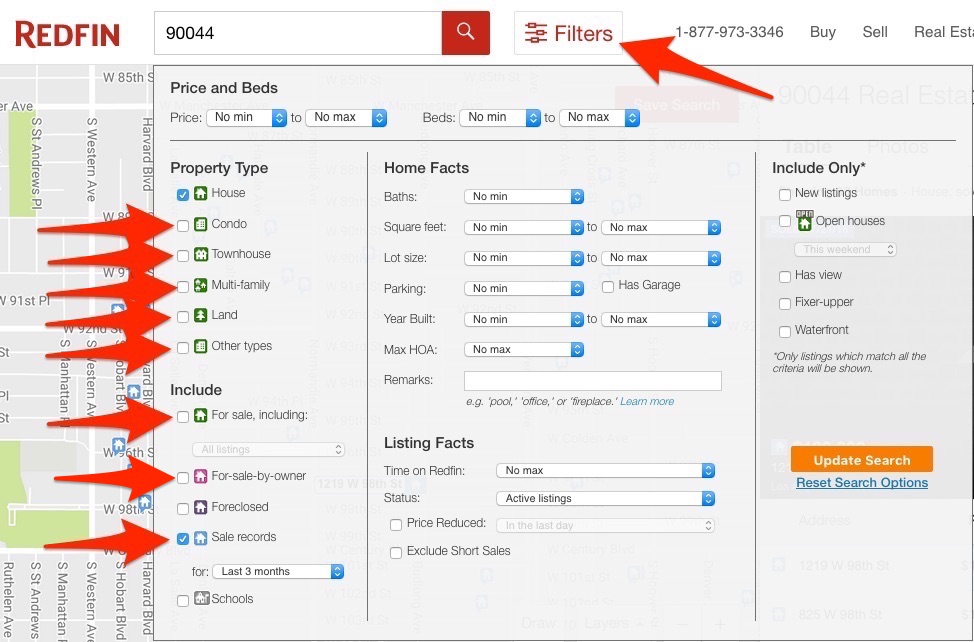
Click on the ‘Update Search’ button.
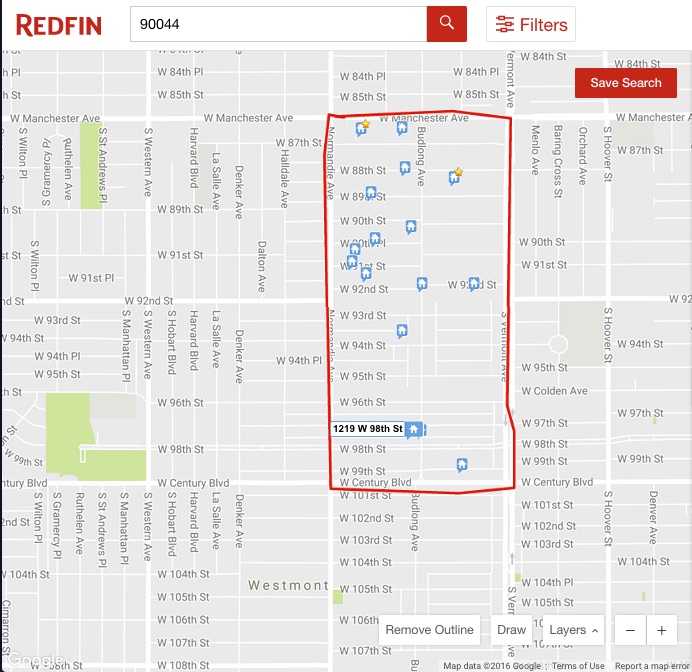
Only two properties are returned with that criteria, so going back further in time is necessary. We now change the ‘Sale records’ option in the filter from ‘Last 3 months’ to ‘Last 1 Year.’
To clarify on search criteria: comparables that have sold within 3 months of the analysis date are ideal but you are not restricted to that range if there are few comparables available. The general rule is, newest in same neighborhood is best, but 6-12 month old properties within the same neighborhood are preferred over 3-6 month old properties outside the neighborhood boundaries.
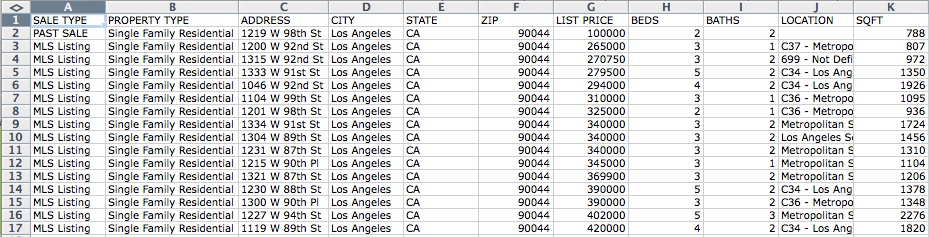
With 1 year past sales selected in the filter, Redfin returns a much better number of properties this time, sixteen.
That number may seem overwhelming, but there is a method to the madness, and this is where Redfin shines.
Downloading the Comps Data
Now that we have the sold properties within an area, notice that all of the data for each property is located in the split screens to the right of the map. Using the slider bar to slide to slide to the bottom of the property list will reveal a hyperlink for (‘Download All).’
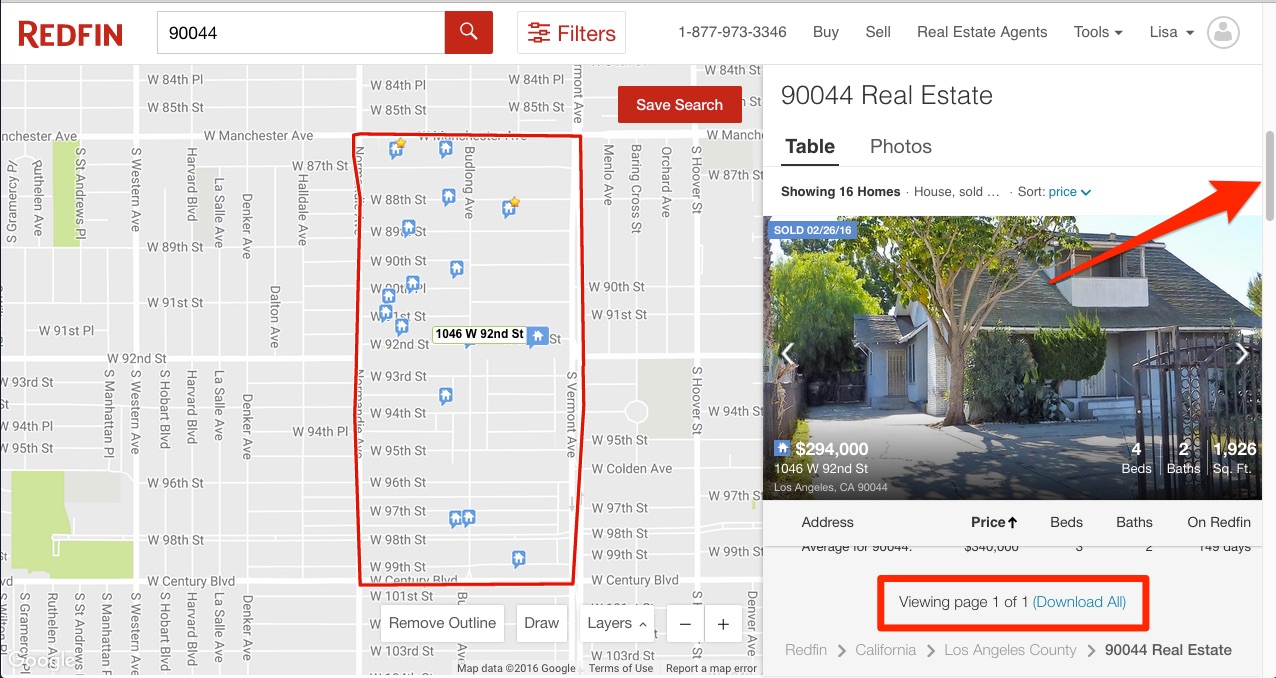
We click on the blue ‘Download All’ link and save or open the file in the save dialog box that pops up.
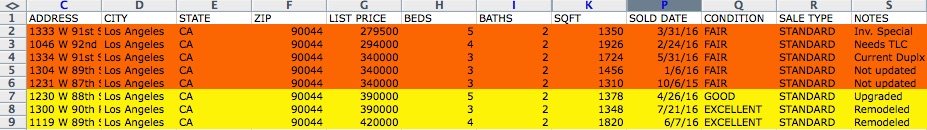
With the file now open in Excel or other spreadsheet software, we can see all of the information that Redfin has provided in the columns:
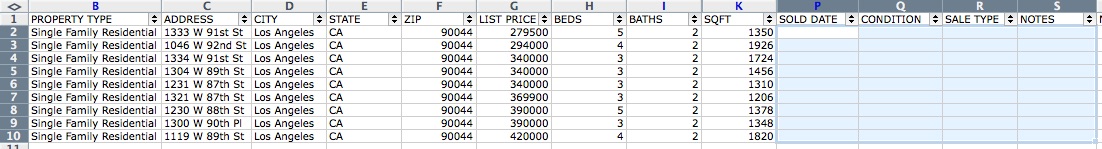
The information is not entirely complete for analysis, however — four columns should be added to the spreadsheet that will be populated with integral information:
STATUS
SOLD DATE
CONDITION
SALE TYPE
So we add those columns to the spreadsheet:
Narrowing Down the Comps
Next, we perform the following steps:
We use some of our knowledge of the five criteria that must be considered when finding comps:
- comp is within the same neighborhood as the subject
- have sold within 3 to 6 months
- have similar features such as the number of beds, baths or inclusion of pools and garages
- have approximately the same square footage
- be of similar construction on the exterior
In line with that criteria we identify listings that are too low in square footage or too high in square footage. These are at the extreme end of the spectrum and will skew our data and be difficult to compare to the subject. In this case with our subject having 1742 square feet, we eliminated properties around or under 1200 sq ft and over 2200 sq ft. There is no hard and fast rule for this step, such as +-500 feet or any figure like that; it will depend on the subject property and the number of comps being compared.
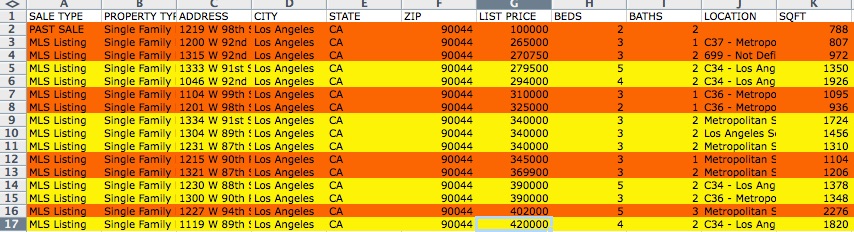
After removing the orange highlighted listings from the spreadsheet, we want to fill in the missing information into those columns we added. The data for those columns can most easily be found on the Redfin.com listing for each of these properties.
Filling in the Blanks
The absolute easiest way to get to the listing page on Redfin for each of these listings is to use the URL in the URL column. Copy and paste the listing’s url into a search engine:
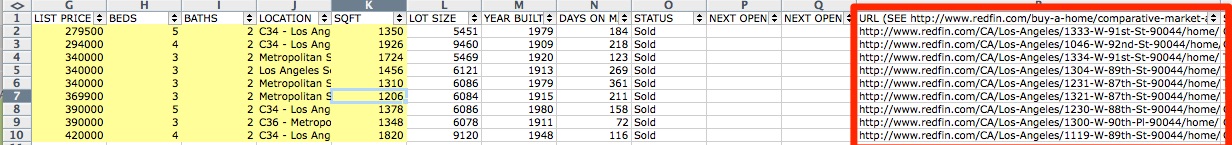
So, we plug into the search engine bar the URL in the URL column for 1333 W 91st St:
http://www.redfin.com/CA/Los-Angeles/1333-W-91st-St-90044/home/7300825
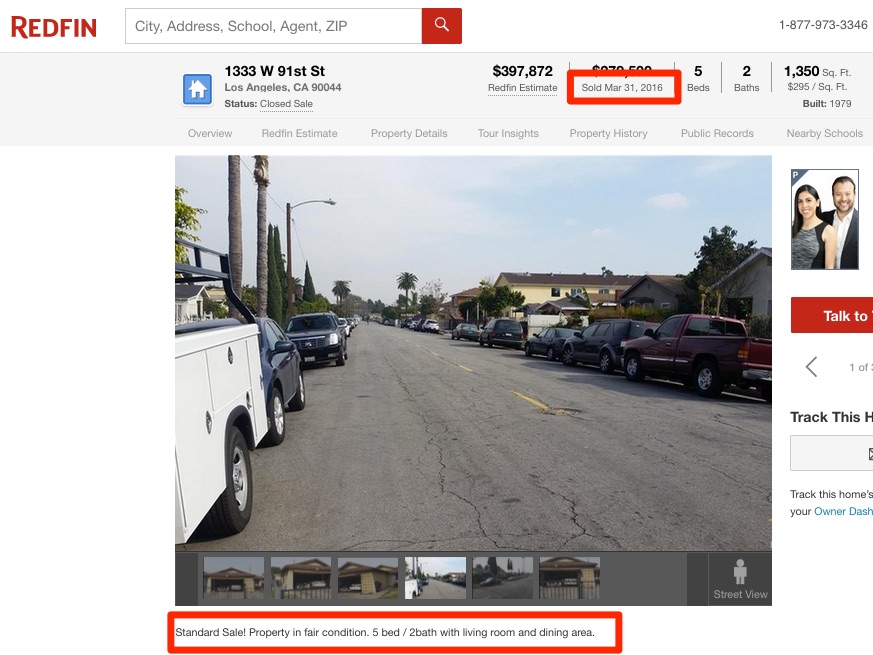
This property sold on March 31st, 2016, so it’s a fairly recent sale, which is good. Also, it’s a standard sale — these are always desired over short sales, wholesale transactions, quit claims, and other types of non-standard sales. However, in the property description it says that the property is in fair condition, and the pictures reflect that as well. We only compare properties that will reflect what the subject property will look like after repairs, which is likely partially or completely remodeled. We enter that information into the spreadsheet and continue until we have looked at the listings for the seven remaining properties:
Results
The first five properties in orange were highlighted for removal, as you can see in the ‘condition’ and ‘notes’ columns, for being in fair condition, investors specials, non-conforming, or simply not updated.
That leaves three excellent or good comps that were remodeled or upgraded, which is the perfect number for adjusting and computing the property’s ARV using the REI/kit ARV Calculator as we explain in this post.
If you liked this post and would like to receive posts on how to improve your fix and flip business as soon as they roll out, please subscribe to the Remote Fix and Flip blog.
Pingback: How to find comps using Redfin and calculate ARV – Part 2 – Remote Fix and Flip
Pingback: How to calculate ARV using the REI/kit ARV Calculator – Remote Fix and Flip